A pdf version of this article is available here
An important paper, Wang et al.[1], on the relationships between cloud feedback, climate sensitivity (ECS) and aerosol-cloud interaction in the latest generation of global climate models (CMIP6) has just been published. The key conclusion of the paper is:
The seeming consistency of global-mean temperature evolution between more positive cloud feedback (high ECS) models and observations requires a strong aerosol indirect cooling effect that leads to an interhemispheric temperature evolution that is inconsistent with observations.
The new open-access paper – the senior author of which, Gabriel Vecchi, is a well known professor of geosciences at Princeton University – provides further evidence that high ECS CMIP6 models do not realistically simulate the behaviour of the Earth’s real climate system.
Background
The spread in estimated ECS has increased further in CMIP6 models; it is 1.8–5.5 K as compared with 2.0–4.7 K in the previous, CMIP5, generation. Far from the science being settled in relation to the response of the climate system to increasing greenhouse gas concentrations, insofar as it is represented by climate models uncertainties appear to be growing.
The main cause of the overall upwards shift in ECS in CMIP6 from CMIP5 – the mean ECS increased by about 0.5 K in addition to the 0.8 K increase in the highest ECS – is more positive cloud feedback, particularly over the Southern Ocean, in many models.[2] The stronger positive cloud feedback arises both from cloud cover and albedo decreasing more with surface temperature, driven by changes in the physical representation of clouds in many CMIP6 models.[3]
However, a growing body of evidence indicates that the high ECS CMIP6 models are unrealistic. For instance, paleoclimate proxy data are not compatible with the high ECS CMIP6 models.[4] The new paper provides further evidence, here from the historical period.
As the authors say in the paper’s Abstract:
We show that models with a more positive cloud feedback also have a stronger cooling effect from aerosol-cloud interactions. These two effects offset each other during the historical period when both aerosols and greenhouse gases increase, allowing either more positive or neutral cloud feedback models to reproduce the observed global-mean temperature change. Since anthropogenic aerosols primarily concentrate in the Northern Hemisphere, strong aerosol-cloud interaction models produce an interhemispheric asymmetric warming. We show that the observed warming asymmetry during the mid to late 20th century is more consistent with low ECS (weak aerosol indirect effect) models.
It was noticed back in 2007 that, in then current models, the change over the 20th century in total forcing was strongly correlated with that in aerosol forcing, and that their ECS was reciprocally related to their total forcing change.[5] That is what one would expect if modellers were tuning their models to match the observed change in global mean surface temperature (GMST). In CMIP5 models, aerosol forcing was more evidently correlated with GMST rise[6] than with ECS. That may well be because fewer modelling groups tuned their models to match the historical rise in GMST. Also, despite it being a solid, very basic part of climate science, there was huge variation in forcing from CO2 and other greenhouse gases in CMIP5 models.
Aerosol forcing, cloud feedback and ECS in CMIP6 models
To help bring out the relationship between cloud feedback and the other variables in CMIP6, Wang et al. separate out from the 30 models they analysed the 9 models with the most positive cloud feedback (range +0.78 to +1.18 Wm−2K−1: T9 models) and the 9 with the least positive cloud feedback (range −0.20 to +0.30 Wm−2K−1: B9 models).[7]
In CMIP6 there is again a strong correlation between aerosol forcing, in particular that related to cloud changes, cloud feedback, and ECS, as Figure S4 of the new paper (reproduced as Figure 1 below) shows. Figure S4 is the same as Figure 1 of the paper except that it only includes one model from each of the 20 institutions, which makes it clearer. B9 models are at the left in each panel of Figure 1, while T9 models are at the right. Due to only one model per institution being included, only six of the B9 models and six of the T9 models are shown.
Panel a of Figure 1 shows that ECS is strongly positively correlated with cloud feedback across CMIP6 models (r2=0.74, or 0.69 if all models from each institution are included).
Panel b of Figure 1 shows a quite strong negatively correlation between cloud feedback and aerosol-mediated cloud radiative response ΔRcaer (which includes both the local aerosol indirect forcing effect on clouds and nonlocal changes in clouds that result from aerosol-induced changes in the large-scale circulation). That is, the T9 models (those with the most positive cloud feedback) tend to have a more negative ΔRcaer than the B9 models.
Somewhat surprisingly, the T9 models have a less negative clear-sky direct aerosol forcing than the B9 models, but the much larger differences between indirect cloud-related aerosol forcing in B9 and T9 models dominate.
The filled circles in Figure 1 represent the top 50% of models graded by the consistency of their simulations with observed historical GMST warming (1990–2014 mean minus 1880–1909 mean); the bottom 50% are shown by open circles. The correlations are stronger when only the 50% of models most consistent with observed GMST warming: the r2 is 0.81 not 0.59 between cloud feedback and ΔRcaer, and is 0.84 between ECS and cloud feedback. Of the ten models whose historical simulations most are consistent with observed GMST warming, four have positive ΔRcaer, and four have weakly negative ΔRcaer (~ –0.5 Wm−2).
The correlation between ECS and ΔRcaer, which is fairly weak (r2 =0.26) when consistency with historical warming is not tested, is strong (r2 = 0.78) across the 50% of models most consistent with observed GMST warming.[8]
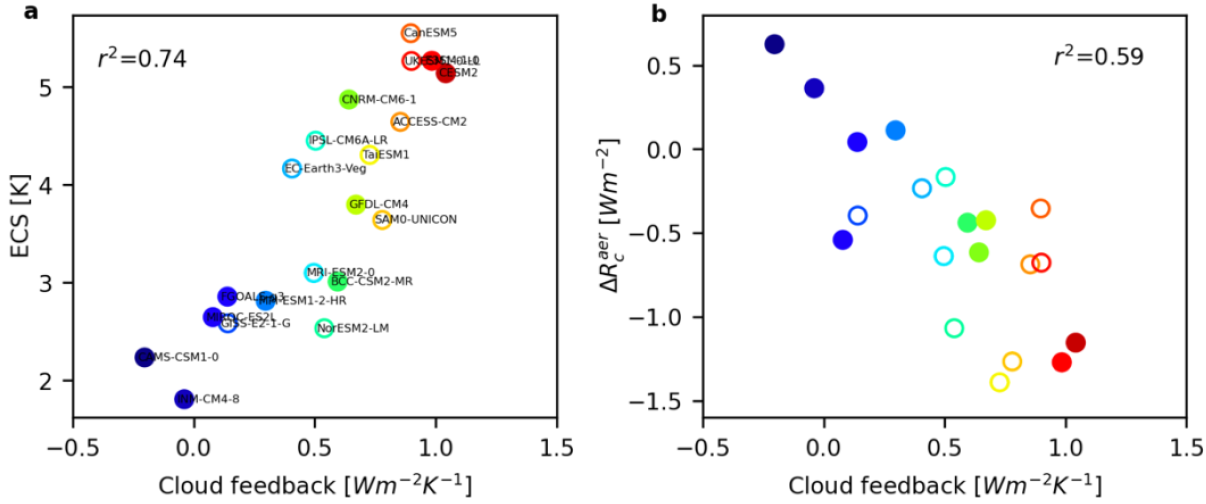
Figure 1. Cloud feedbacks, ECS, and aerosol-mediated cloud radiative responses (ΔRcaer) in CMIP6 models; one model per institution. Reproduced from Figure S4 of Wang et al. B9 models are shown by the leftmost circles in each panel of Figure 1, while T9 models are shown by the rightmost circles, only six of each being included due to the restriction to one model per institution.
The paper points out that, since anthropogenic aerosol emissions are very largely in the northern hemisphere, models with stronger aerosol-mediated cloud radiative responses should show greater interhemispheric asymmetry in total cloud radiative response (cloud forcing) and hence in warming.
The authors say:
Due to the larger cooling effect of the aerosol-cloud interaction, T9 models simulate slightly colder surface temperature anomalies during the mid to late 20th century compared to the B9 models (Figure 4a), even though the T9 models have a more positive cloud feedback and a higher ECS. While this difference between the B9 and T9 models’ surface temperature anomaly is small when globally averaged (and only few scattered years are significantly different—indicated by the gray shading), the hemispheric asymmetry of the historical aerosol forcing induces substantial differences in the interhemispheric warming asymmetry (Figure 4b).
Figure 2, which reproduces Figure 4 in the paper, illustrates these points.
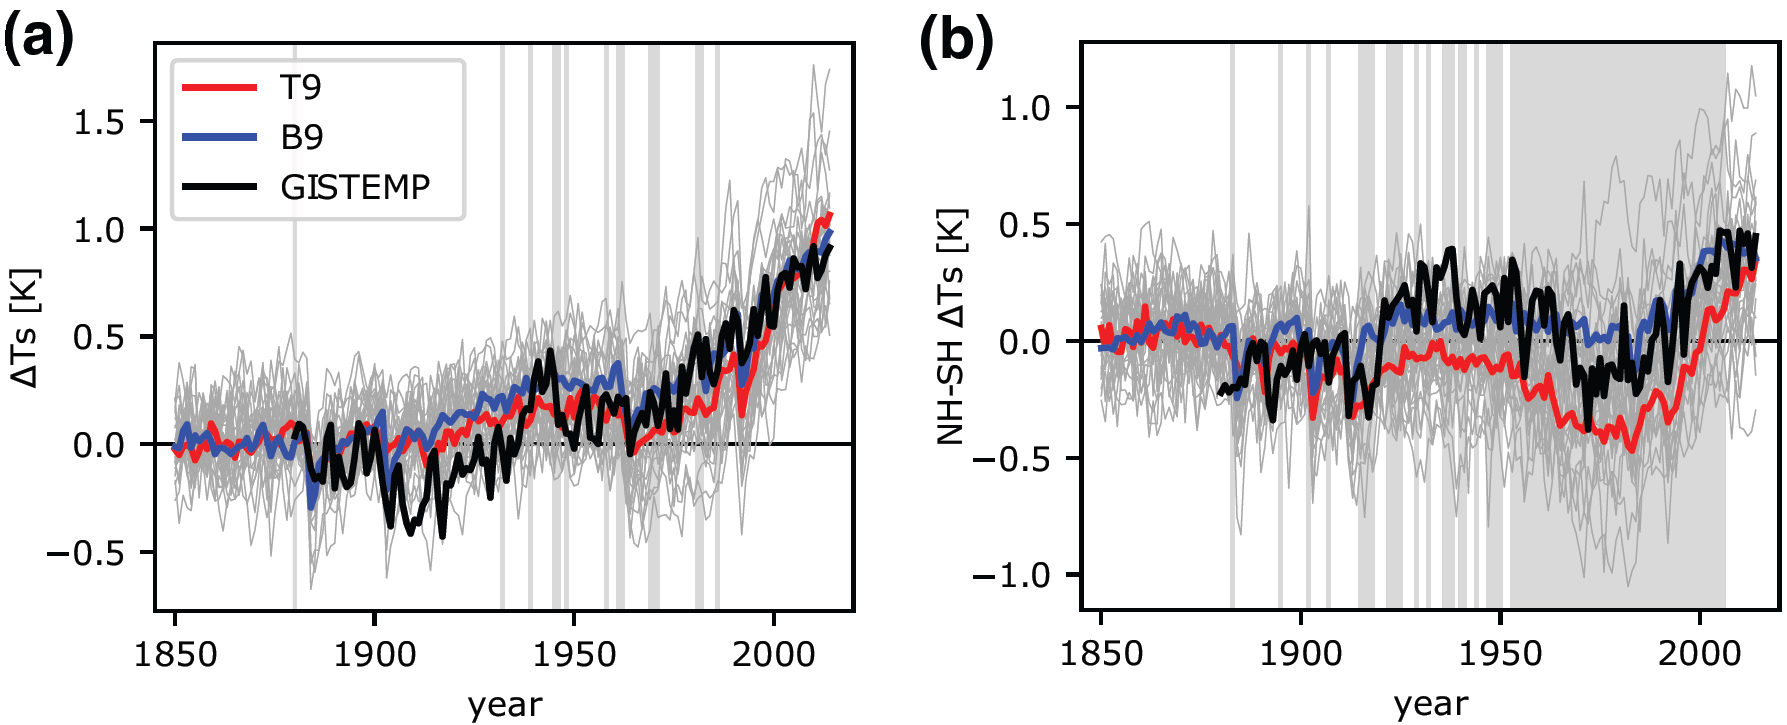
Figure 2. Modeled and observed surface temperature change. A reproduction of Figure 4 in Wang et al. Annual time-series of (a) the global-mean surface temperature anomaly and (b) the interhemispheric contrast of surface temperature anomaly. The black line is from GISTEMP and is rebased to match the model ensemble mean of the 1951–1980 period value. Each thin gray line represents a single ensemble from one model. The red and blue lines indicate the model ensemble mean of the T9 and B9 models, respectively. The gray shadings indicate the years that the difference between T9 and B9 are significant (t-test, p < 0.05).
The authors go on to say:
The observed interhemispheric warming asymmetry over the 20th century is more consistent with the models with weaker cloud feedback and aerosol indirect effect (B9) than those with more positive cloud feedback and aerosol indirect effect (T9).
Conclusions
In the paper’s discussion section the authors conclude:
Both more positive (high ECS) and less positive (low ECS) cloud feedback models are able to simulate the observed global-mean temperature record, but T9 models do it through a combination of strong warming from GHGs and strong cooling from aerosols, while B9 models do it with moderate warming from GHGs and modest cooling from aerosols. Because historical aerosol forcing has been larger in the Northern Hemisphere, the strong aerosol-cloud interactions cooling effect in T9 models produces a distinctive historical interhemispheric surface temperature evolution (red line in Figure 4b), which is inconsistent with that in observations over 1950–2000 (black line in Figure 4b). These results support the recent findings that the CMIP6 models more faithfully capture the observed evolution of surface anomalies across a range of quantities over 1980–2014 tend to have lower 21st century projected warming.
Only five out of the thirty CMIP6 models analysed are B9 models (those which are consistent with the evolving interhemispheric surface temperature contrast) that are also in the top 15 models for consistency with historical GMST warming.[9] Their range of estimated ECS is 1.81–2.86 K, with a mean of 2.5 K, far lower than the mean of 3.7 K for all the models. Those institutions that have developed CMIP6 models with ECS values comfortably above 4.5 are increasingly looking as if they may have taken a wrong turn somewhere. Somewhat surprisingly, they include several highly regarded modelling centres, such as NCAR and the UK Met Office.
Nicholas Lewis 5 March 2021
[1] Wang, C., Soden, B. J., Yang, W., & Vecchi, G. A. (2021). Compensation between cloud feedback and aerosol-cloud interaction in CMIP6 models. Geophysical Research Letters, 48, e2020GL091024. doi.org/10.1029/2020GL091024
[2] Flynn CM, Mauritsen T. On the climate sensitivity and historical warming evolution in recent coupled model ensembles. Atmospheric Chemistry and Physics. 2020 Jul 6;20(13):7829-42. doi.org/10.5194/acp-20-7829-2020
[3] Zelinka MD, Myers TA, McCoy DT, Po-Chedley S, Caldwell PM, Ceppi P, Klein SA, Taylor KE. Causes of higher climate sensitivity in CMIP6 models. Geophysical Research Letters. 2020 Jan 16;47(1):e2019GL085782. https://doi.org/10.1029/2019GL085782
[4] Zhu J, Poulsen CJ, Otto-Bliesner BL. High climate sensitivity in CMIP6 model not supported by paleoclimate. Nature Climate Change. 2020 May;10(5):378-9. https://doi.org/10.1038/s41558-020-0764-6
[5] Kiehl JT. Twentieth century climate model response and climate sensitivity. Geophysical Research Letters. 2007 Nov;34(22). https://doi.org/10.1029/2007GL031383
[6] Rotstayn LD, Collier MA, Shindell DT, Boucher O. Why does aerosol forcing control historical global-mean surface temperature change in CMIP5 models?. Journal of Climate. 2015 Sep 1;28(17):6608-25. https://doi.org/10.1175/JCLI-D-14-00712.1
[7] Their results are not sensitive to the number of models chosen for this purpose.
[8] Correlations are very similar when the model set is not restricted to one model per institution.
[9] CAMS-CSM1-0, FGOALS-g3, INM-CM4-8, MIROC-ES2L and MPI-ESM1-2-HR (MPI-ESM1-2-LR replaces MPI-ESM1-2-HR if no restriction to one model per institution is applied; the two model versions have almost identical estimated ECS).
Leave A Comment