Originally a guest post on November 30, 2016 at Climate Etc.
[W]e estimate that the warming slowdown (< 0.1 K/decade trend beginning in 1998) could persist, due to internal variability cooling, through 2020, 2025 or 2030 with probabilities 16%, 11%, and 6%, respectively.
– Knutson et al.
A new paper by Tom Knutson, Rong Zhang and Larry Horowitz of NOAA GFDL has just been published in Nature Communications [link to full manuscript]. The authors take a well-balanced approach to seeking possible explanations for global mean surface temperature (GMST) increasing at a much lower rate from around the turn of the century than over the late 20th century, and consider the possibility that it may continue for some time.
The abstract reads:
Observed global mean temperature over 1998 to 2015 increased at a slower rate (0.1 K decade-1) compared to the ensemble mean (forced) projected by Coupled Model Intercomparison Project 5 (CMIP5) models (0.2 K decade-1). Here we investigate the prospects for this slower rate to persist for a decade or more. The slower rate could persist if the transient climate response is overestimated by CMIP5 models by a factor of two, as suggested by recent low-end estimates. Alternatively, using CMIP5 models’ warming rate, the slower rate could still persist due to strong multidecadal internal variability cooling. Combining the CMIP5 ensemble warming rate with internal variability episodes from a single climate model – having the strongest multidecadal variability among CMIP5 models – we estimate that the warming slowdown (< 0.1 K decade-1 trend beginning in 1998) could persist, due to internal variability cooling, through 2020, 2025 or 2030 with probabilities 16%, 11%, and 6%, respectively.
The authors say that CMIP5 and earlier generation climate models’ historical forcing simulations, in the ensemble mean, reproduce well observed late 20th century warming and a hiatus during around 1940–1970, in response to anthropogenic and natural forcings. However, these models do not reproduce the rapidity of the observed early 20th century warming, suggesting that internal (unforced) climate variability played a minor role in the two later episodes but a significant one in the early warming.
Although this comparison with observations does at first sight suggest such a conclusion, the satisfactory reproduction of the 1940–1970 hiatus and late 20th century warming by the CMIP5 ensemble could have other explanations. Whilst in the ensemble mean of climate models the mid-century hiatus and late century warming no doubt are almost entirely forced, there is reason to believe that in the real world multidecadal internal variability –linked to the Atlantic multidecadal oscillation (AMO) and the Pacific Decadal Oscillation (PDO) – played a significant role, depressing the GMST trend from 1940 to the early/mid 1970s and increasing it from then until the turn of the century.[i] In many CMIP5 climate models, excessive strengthening of negative aerosol forcing (cooling) during the 3rd quarter of the 20th century may have served to mimic the effect on GMST of missing multidecadal internal variability. And excessive transient climate response (TCR) levels in CMIP5 models may have compensated, in the late 20th century, for their lack of a positive influence of internal variability on GMST.
As cited by the authors, some recent studies suggest that misrepresentation of forcing accounts for the rapid post-2000 warming in CMIP5 models exceeding the observed warming.[ii] However, these studies focused on individual forcings, such as solar and stratospheric (volcanic) aerosols. When all forcings are taken into account – some of which grew more positively after 2005 than in the RCP scenarios – there is little evidence that the rate of increase in actual total net forcing was overestimated in CMIP5 models. In a thorough investigation of the situation in the NorESM1-M model, it was estimated that over 1998–2012 the actual forcing trend was about 20% higher than that in the RCP8.5 scenario.[iii]
Sensibly, Knutson et al. effectively discount explanations of the early 21st century warming slowdown based on misstated forcing changes, missing temperature data in warming regions such as the Arctic, and the like. Instead they “explore how long an early 21st century hiatus or slowdown could last, assuming a strong internally generated cooling superimposed upon ongoing anthropogenic warming.” They focus on the period 1998–2015, pointing out that:
The warming rate from El Niño peak to peak (1998 to 2015) in observations was about 0.11 K decade−1, and similar (0.10 K decade-1 ) if the two El Niño years at each end are excluded (i.e., 1999 to 2014).
Further, they state:
Reducing the CMIP5 forced warming rate by 50% (to 0.1 K decade-1 ) yields a trend close to the observed warming rate. … if the CMIP5 models overestimate TCR by a factor of two, we might expect global mean temperatures over the next few decades to continue (on average) along the observed trend trajectories since about 1998.
The in press Barcikowska et al. J. Climate paper, of which Knutson and Zhang are co-authors, also points (Fig. 1) to the prospects of the AMO, after peaking during the 2000s, contributing to global surface warming through to 2030 being perhaps ~0.05 K decade-1 slower than the underlying forced trend. This is also consistent with the findings in Delsole et al (2011).
Further, the Stadium Wave paper predicted the same. According to its press release:
The stadium wave hypothesis provides a plausible explanation for the hiatus in warming and helps explain why climate models did not predict this hiatus. Further, the new hypothesis suggests how long the hiatus might last.
“The stadium wave signal predicts that the current pause in global warming could extend into the 2030s,” said Wyatt, the paper’s lead author.
Apart from the influence of multidecadal internal variability, Knutson et al. raise the possibility that the average TCR of CMIP5 models exceeds the transient GMST response of the real climate system. In this connection, it is interesting how consistent the temperature response to forcing (per AR5) has been since 1850. If one excludes years with significant volcanic forcing, which produces an abnormally small temperature response (Gregory et al 2016),[iv] plotting global annual temperature against forcing gives points that cluster closely around a straight line, particularly if the AMO[v] component is removed. Figure 1 shows a plot that I have produced to demonstrate the remarkably linear relationship between AMO-adjusted GMST and forcing.[vi] Gregory and Forster (2008)[vii] used the same method to estimate TCR, excluding years with volcanic forcing stronger than –0.5 W m⁻², although without adjusting for the AMO’s influence.
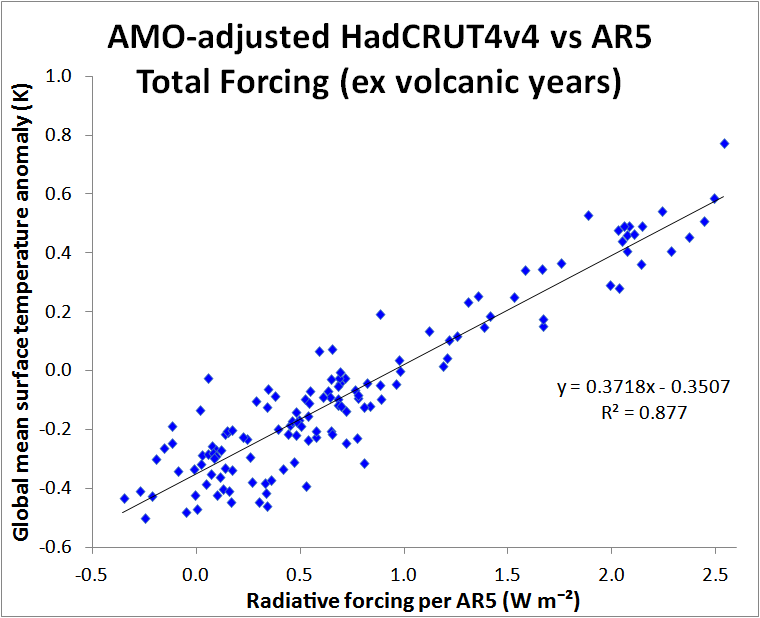
Figure 1. Annual AR5 forcing and AMO-adjusted GMST data for 1850–2015, excluding years with volcanic forcing stronger than –0.6 W m-2. Black: OLS regression best fit line, formula and R2.
The line slope equates to a TCR of 1.38 K,[viii] close to the 1.33 K estimated in Lewis & Curry 2014.[ix] An article recently published here,[x] which used post-1950 GMST time series adjusted to remove the influences of ENSO and volcanic and solar forcing variability, came up with a median TCR estimate of 1.35 K. Whilst such observationally-based TCR estimates are uncertain, I find unconvincing arguments that “energy budget” observationally-based TCR estimates like these, which take care to minimise volcanic and multidecadal internal variability influences, are depressed by the mix of forcings acting during the instrumental period having less warming effect than the same amount of CO2 forcing: the evidence used seems flawed to me.[xi]
A TCR in the range 1.33–1.38 K is well below the mean TCR of ~1.8 K for CMIP5 models. This supports Knutson et al.’s suggestion that the transient response of CMIP5 models, on average, exceeds that of the real climate system. Based on these estimates, the average TCR of CMIP5 models likely exceeds that in the real world by about 30% – Knutson’s factor of two is based on the lower uncertainty bounds of observational estimates, not on their medians. However, the future warming projected by CMIP5 models is on average 65% or more above that projected by simple but physically-consistent models with a TCR of ~1.35 K.[xii]
Nicholas Lewis
Update from Tom Knutson:
Tom Knutson has commented by email in relation to this post, as follows :
“One minor clarification is that we are not yet convinced that the mid-twentieth century hiatus and the accelerated warming of the late 20th century are simply forced responses.
Referring to the mid 20th century hiatus (p. 7) we note that “an important role for internal climate variability is suggested, as the CMIP5 forced response deviates from the observed spatial pattern.” As to the late 20the century accelerated warming period, we note (p. 7) that “…if models overestimate the TCR (forced warming rate), internal variability may have also played a significant role in the late 20th century global warming.”
We don’t explicitly say that the mid-20th century hiatus of global mean temperature may have been largely due to internal climate variability cooling offsetting anthropogenic warming (as opposed to aerosols and volcanic forcing providing the offsetting cooling). We probably should have said this explicitly as a possibility.
However, once one accepts that internal variability likely played a substantial role in early 20th century warming, it follows that internal variability may have well contributed similar negative or positive trends to global mean temperature for the mid 20th century hiatus and the late 20th century accelerated warming periods.”
End notes
[i] DelSole T, Tippett MK, Shukla J (2011) A significant component of unforced multidecadal variability in the recent acceleration of global warming. J Clim 24:909–926
[ii] Huber, M. & Knutti, R. Natural variability, radiative forcing and climate response in the recent hiatus reconciled. Nature Geosci., 7, 651-656 (2014); Schmidt, G. A., Shindell, D. T., & Tsigaridis, K. Reconciling warming trends. Nature Geosci., 7, 158-160 (2014); Santer, B. D., et al. (2014), Volcanic contribution to decadal changes in tropospheric temperature, Nat. Geosci., 7, 185–189.
[iii] Outten, Stephen, et al. “Investigating the recent apparent hiatus in surface temperature increases: 1. Construction of two 30‐member Earth System Model ensembles.” Journal of Geophysical Research: Atmospheres 120.17 (2015): 8575-8596. The estimated excess positive linear trend relative to RCP8.5 is 0.08 W m−2 dec−1, compared with a linear trend under RCP8.5 of ~0.38 W m−2 dec−1 per the RCP forcings dataset when no post-2005 volcanism is assumed.
[iv] Gregory, J. M., et al. “Small global-mean cooling due to volcanic radiative forcing.” Climate Dynamics (2016): 1-13.
[v] Enfield DB, Mestas-Nunez AM, Trimble PJ (2001) The Atlantic multidecadal oscillation and its relationship to rainfall and river flows in the continental US. Geophys Res Lett 28:2077–2080
[vi] The AMO values used are 5-year moving average residuals from regressing non-detrended annual AMO values5 on the same AR5 forcing time series as is used to regress temperature against, for the same years, so they do not carry any forcing signal. The removed AMO component was given a peak-to-peak amplitude of 0.25 K.Years with volcanic forcing stronger than –0.6 W m⁻² have been excluded. These magnitudes were selected to minimise the regression errors.
[vii] Gregory JM, Forster PM (2008) Transient climate response estimated from radiative forcing and observed temperature change. J. Geophys. Res. 113.
[viii] When multiplied by the standard forcing value of 3.71 W m-2 for a doubling of CO2 concentration.
[ix] Lewis N., Curry J.A., 2014. The implications for climate sensitivity of AR5 forcing and heat uptake estimates. Clim. Dyn. , 45 (2015), 1009–1023. DOI 10.1007/s00382-014-2342-y
[x] https://judithcurry.com/2016/10/26/taminos-adjusted-temperature-records-and-the-tcr/
[xi] See https://niclewis.wordpress.com/appraising-marvel-et-al-implications-of-forcing-efficacies-for-climate-sensitivity-estimates/
[xii] http://www.thegwpf.org/content/uploads/2014/03/A-Sensitive-Matter-download.pdf
Leave A Comment